How to Track Conversions Correctly. Six Standard Attribution Models.
Nothing is more important for a marketer than correctly tracking the effectiveness of a company’s marketing activities. Are your ads working? Is it worth staying active on social media? Are your email campaigns effective? A properly configured attribution model can answer these important questions.

However, there are few things in analytics more complicated than setting up a good attribution model. According to a survey, 77.6% of marketers are uncertain if they are using the correct attribution model, while 29.7% chose their current model because it was easy to implement.
Given the complexity of the task, it is necessary to answer a number of questions in depth:
- Which type of attribution model should you choose: single-touch or multi-touch? If you choose the first, should you measure last-click or first-click conversions? If you use a multi-touch model, how can you gauge the contribution of each marketing channel to the conversion?
- How can you measure the influence of display ads on sales? Do display ads make sense at all, if the goal is sales? If so, how can you calculate their impact on specific sales? Should you only count conversions that were made after clicking on the display ad? Or should you also consider conversions by people who saw your display ad, but didn’t click on it? If so, then how?
- What should the conversion window be? The answer to this question will determine both the number of conversions recorded and the accuracy of the data itself. If the conversion window is too much longer than the company’s real sales cycle, then the number of recorded conversions will be inflated. On the other hand, if the conversion window is shorter than the sales cycle, then conversions that actually belong to a certain channel will be “stolen”.
In order to answer these and many other questions, we will take a good look at the data of Rontar’s Big Data platform. This, I believe, is the only guide you will need to configure an effective and complete conversion attribution model for your company.
OK, let’s go.
Attribution models: definition and types
An attribution model is the rule, or set of rules, that determines the contribution of each marketing channel on the path to conversion. In other words, a properly configured attribution model will let you know whether or not your search ads, retargeting, email campaigns, and other marketing channels affect the total number of conversions — and, if so, how.
An attribution model is the rule that determines the contribution of each marketing channel to a conversion. Click To TweetAll existing attribution models can be divided into two major categories: single-touch attribution models and multi-touch attribution models.
Single-touch attribution models
At present, 39% of marketers use single-touch attribution models.
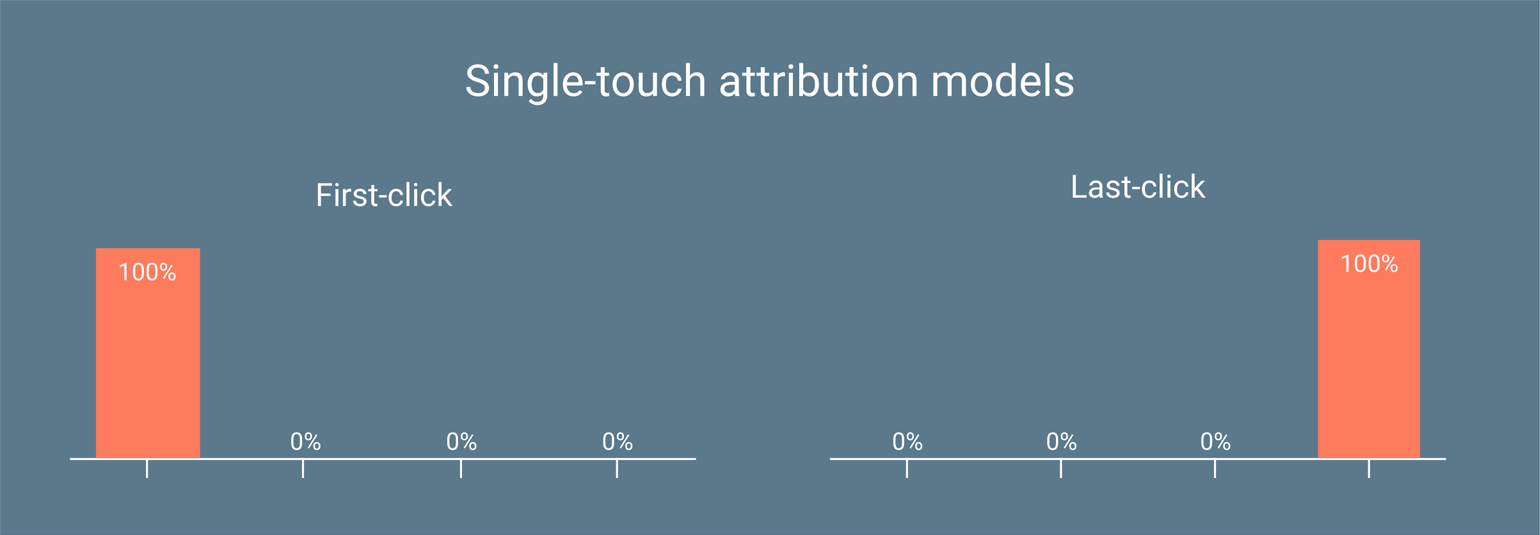
Single-touch models give credit for a conversion to only one of the channels on the path to conversion. Depending on the stage at which this channel came into play, marketers divide single-touch models into the last-click and first-click models.
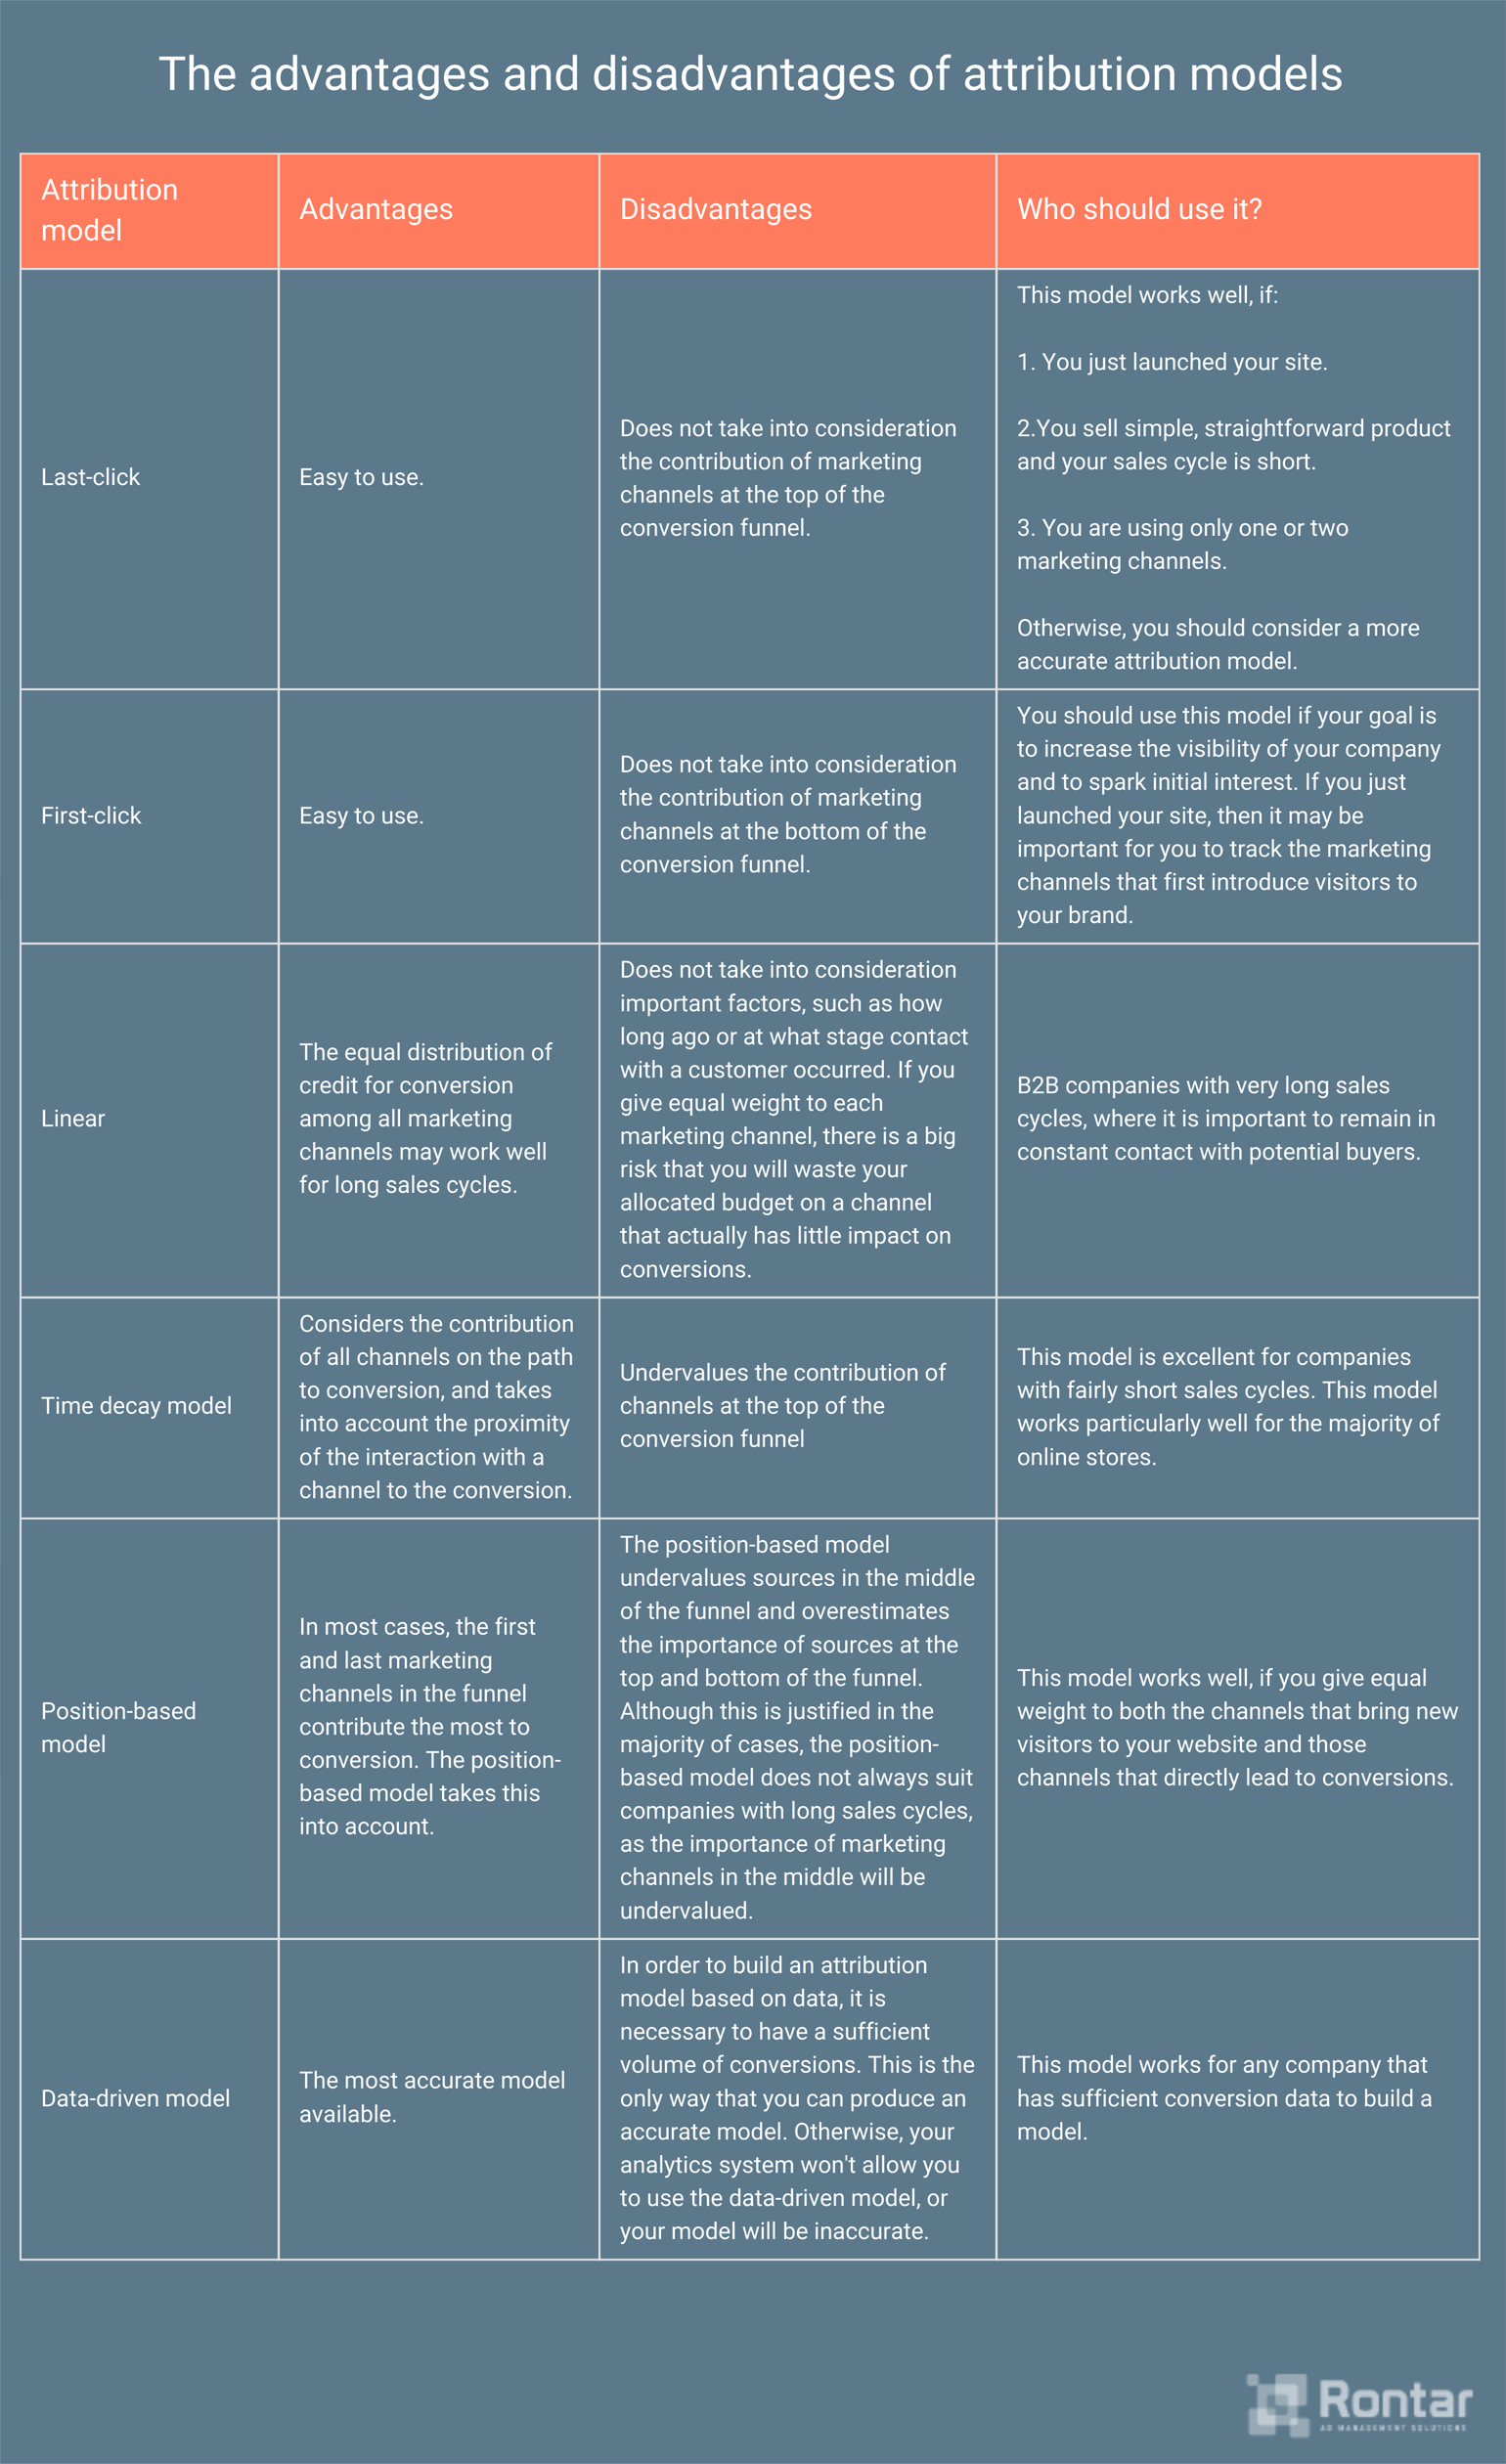
Last-click
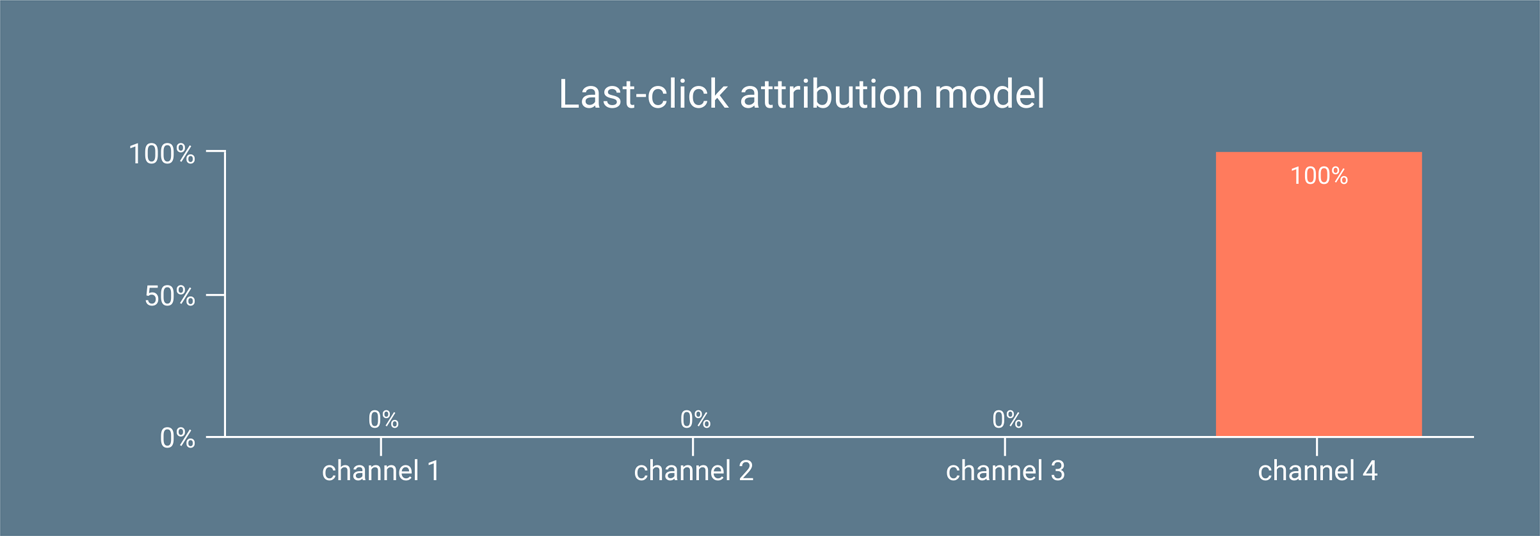
This model is the default attribution model of most analytical services. Likewise, the majority of marketers, 28.4%, currently measure the success of their marketing initiatives using the last-click model (last cookie wins, last-click attribution). The model gives credit for the conversion to the last marketing channel to engage the consumer on the path to conversion and completely ignores the contribution of other marketing channels.
Advantages
Simplicity. Even a basic report will be enough to help you judge which advertising channels are working and which aren’t.
Disadvantages
The last-click model completely ignores any other interaction the customer has with your marketing channels on the path to conversion.
A potential buyer visits a site an average of 9.5 times before making a purchase. In the case of B2B companies, customers may require even more visits: from 7 to 13 or more. A customer could interact with your company multiple times over a span of several weeks or even months, but only the last channel in the funnel will receive credit for the conversion. However, there are times when the marketing channels in the beginning or middle of the funnel make the biggest contribution to conversions.
A potential buyer visits a site an average of 9.5 times before making a purchase. Click To TweetImagine that you sell women’s clothing in medium and high price segments. You have an advertising campaign set up on Facebook to target women between the ages of 18-25. You also use retargeting, which encourages visitors who did not make a purchase to return to the site. In the advertising channel reports on your analytics system, you see the following picture:
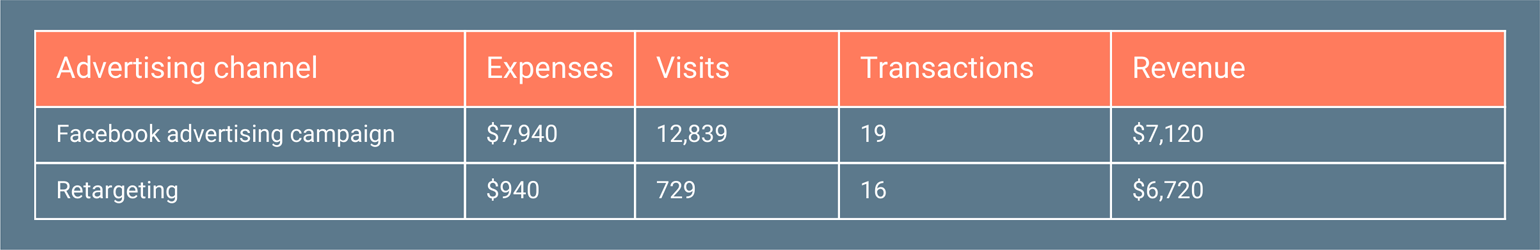
Most of your site’s traffic comes from your Facebook advertising campaign, but this campaign does not generate profit. Retargeting brings ten times less traffic to the site, but the number of conversions is practically the same as that of the Facebook campaign. The retargeting campaign pays off.
On the basis of these statistics, you decide to cancel your Facebook advertising campaign. After awhile, you see the following picture:
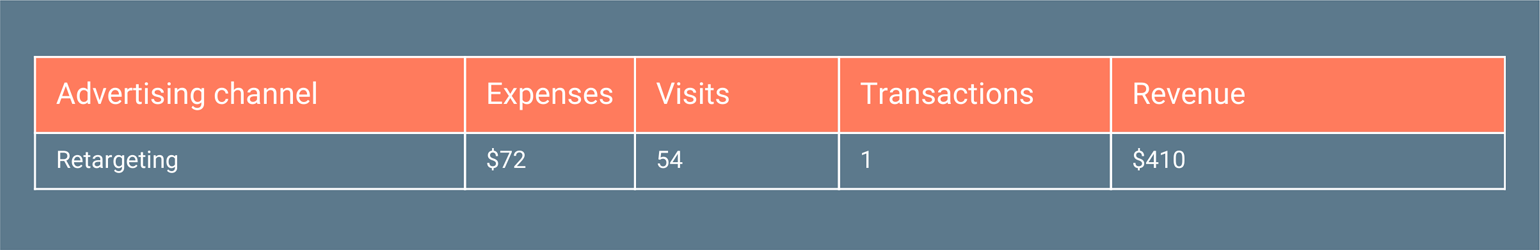
As soon as you turned off your main source of traffic, the number of conversions from retargeting decreased. The overall revenue of the company decreased as well.
The example above is oversimplified in order to present the problem clearly. In real situations, the customer will interact with multiple marketing channels on the path to conversion. Determining the contribution of each of these channels to conversion will be quite challenging.
Who should use this model?
The last-click model is a model of the utmost simplicity, and that is its main advantage. However, the main goal of analytics is to determine precisely what works and what doesn’t. Even though 29.7% of marketers choose an attribution model based on ease of use, in most cases, I would not advise sacrificing the accuracy of your measurements for the sake of simplicity. I would not recommend that marketers use this as their main attribution model.
29.7% of marketers choose an attribution model based on ease of use. Click To TweetIf your company has just opened, you sell a simple, straightforward product, the sales cycle is short, you only have one or two marketing channels, and your activity is focused on attracting customers here and now, you can try using last-click temporarily. In the future, as you incorporate a greater number of marketing channels, you will need to switch to one of the more advanced models.
First-click
First-click, the second most popular single-touch attribution model, is used by 10.5% of marketers.
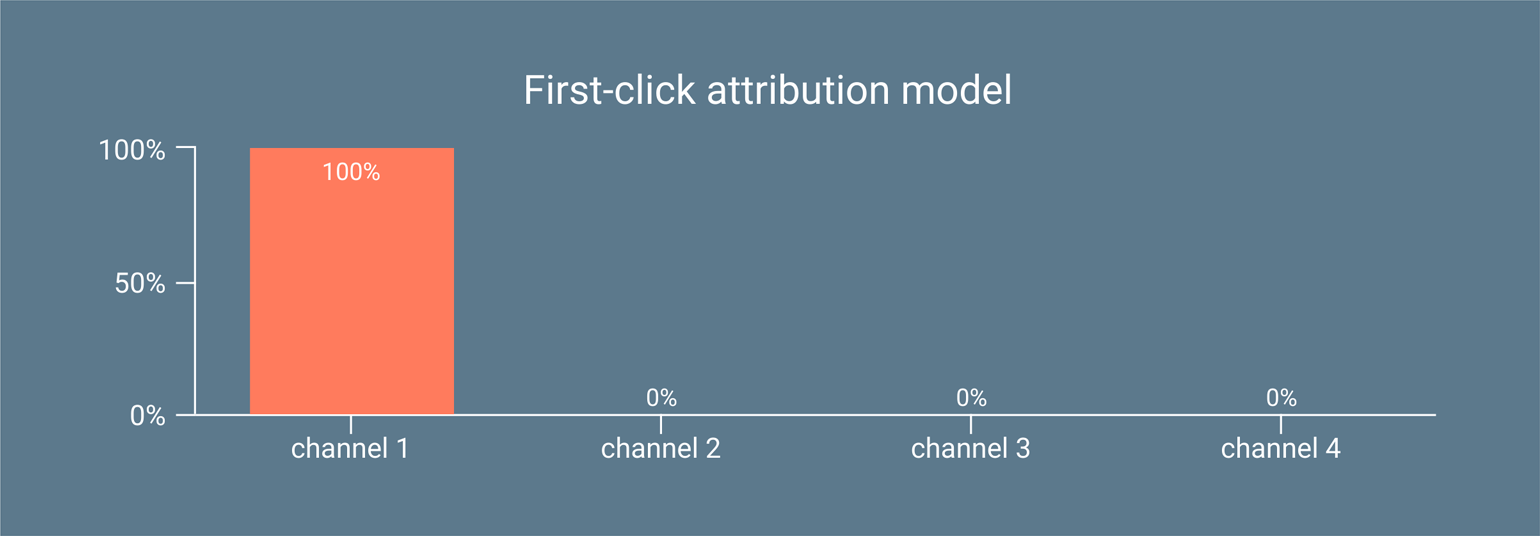
This model is the opposite of the last-click model. The last-click model gives credit for conversion to the last channel in the funnel. The first-click model gives credit for conversion to the very first marketing channel in the path to conversion.
Advantages
Like last-click, the first-click model is extremely easy to use.
Disadvantages
You can be sure that the last marketing channel in the funnel influenced the conversion in some way. However, you can’t be sure that the first marketing channel did. How did a click on a banner ad a month ago affect the conversion of a person who later returned to the site? Obviously, data on conversions will only misguide you and prevent you from identifying those sources that actually influence sales.
Who should use this model?
The first-click model is the least accurate of all the models and can seriously distort your data. The first-click model leads companies to spend the bulk of their marketing budget on those channels that create initial interest, rather than those channels that really influence conversions.
Multi-touch attribution models
Single-touch attribution models, like last-click and first-click, give credit for a conversion to only one of the channels on the path to conversion. If you have only one or two marketing channels, these models are a fairly easy and accurate way to determine what is working and what isn’t. However, as soon as you begin to add more marketing channels, the data will become less accurate. The more marketing channels, the less accurate the data derived from single-touch models.
Multi-touch models are designed to go further. Ideally, they will evaluate the contribution of each marketing channel on the path to conversion.
Currently, 61% of marketers use multi-touch attribution, and that number grows each year.
Let’s take a look at each major multi-touch model separately.
Linear attribution model
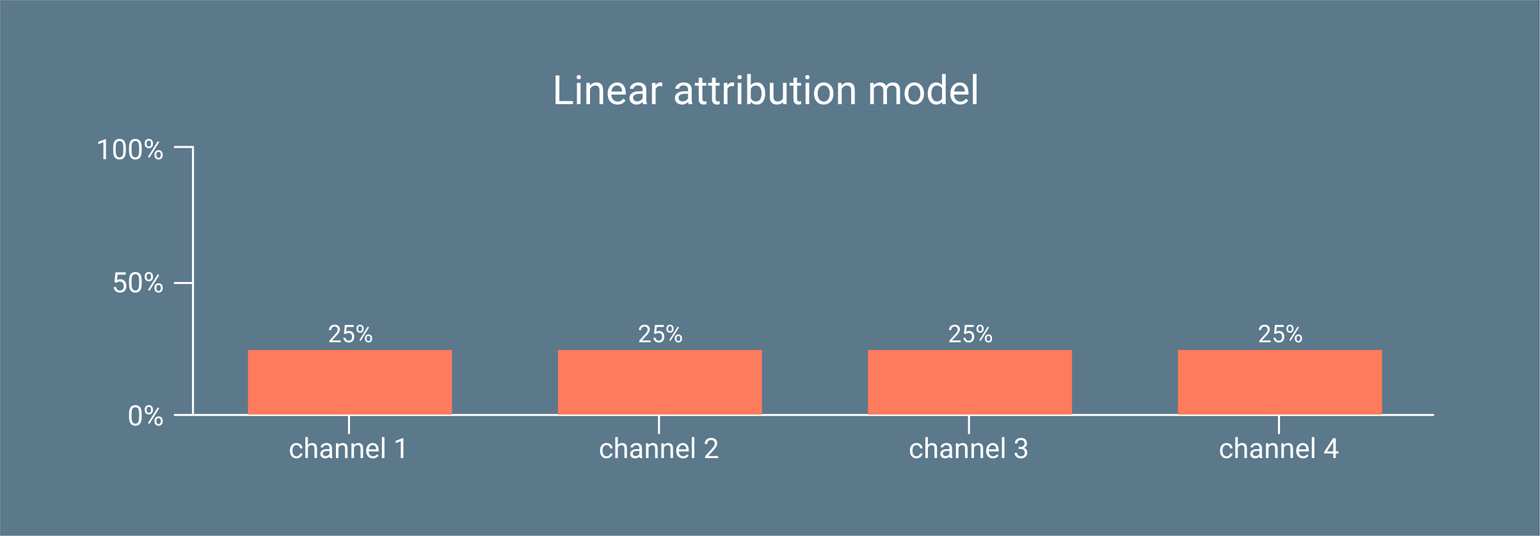
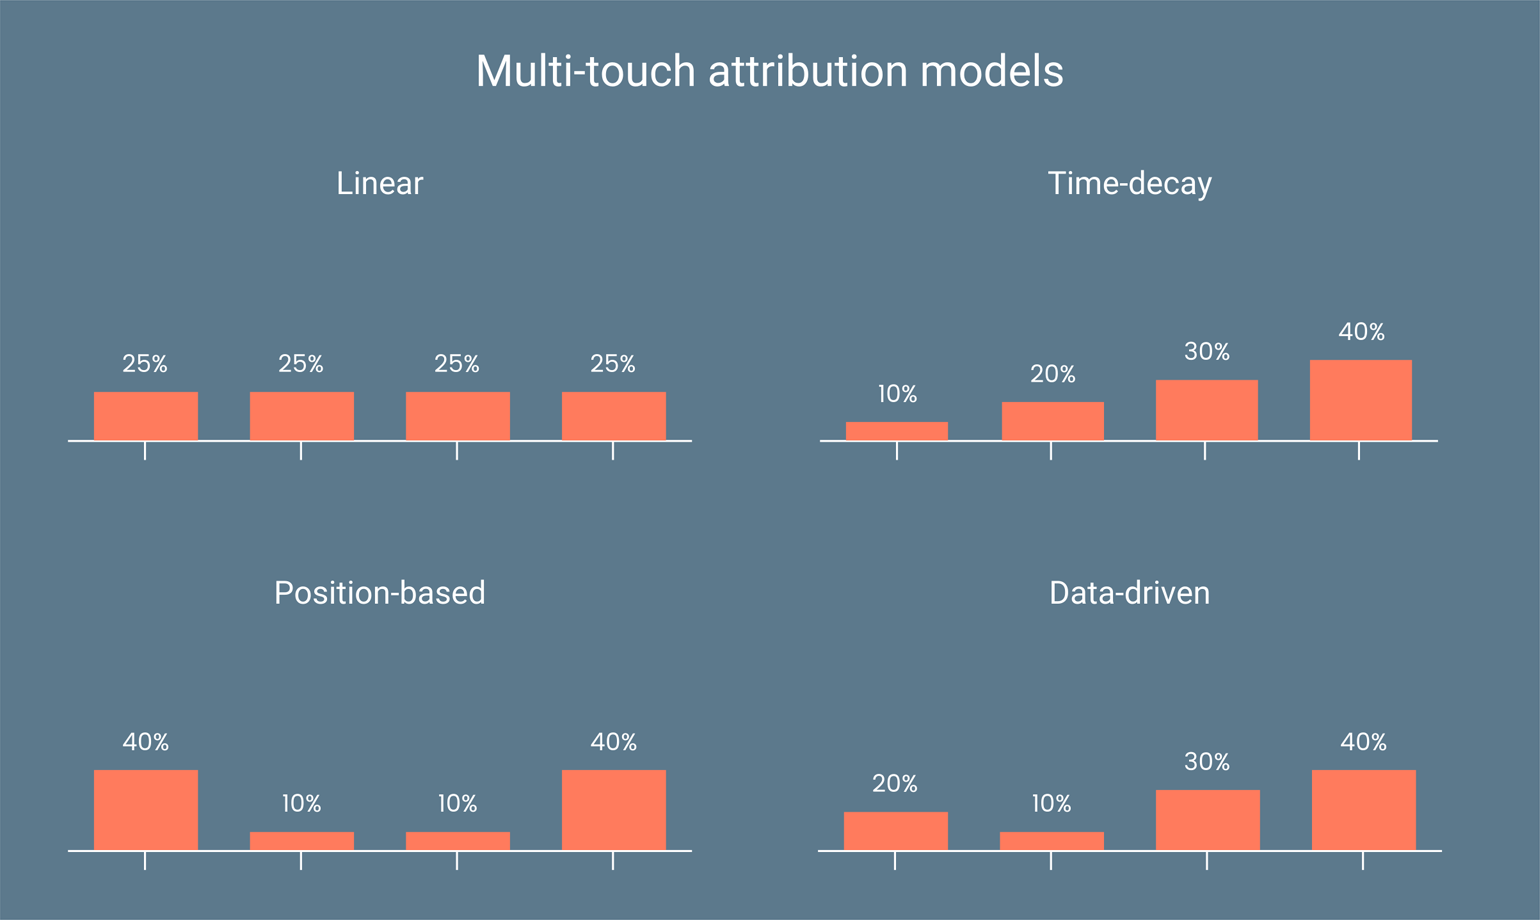
The linear model gives equal weight to each marketing source when calculating contributions to a conversion.
This model is the second most popular multi-touch attribution model. B2B companies, especially, use it frequently. This model is used by 8.2% of marketers.
Advantages
The linear model can be useful, if you need to maintain contact with a potential buyer throughout the sales cycle. In this case, it will be fine if credit for a conversion is evenly distributed between your marketing channels.
Disadvantages
The linear attribution model is one of the least complicated of the multi-touch models. It does not take into consideration important factors, such as how long ago an interaction with the customer occurred or at what stage that contact took place. If you give equal weight to each of your marketing channels, you risk wasting your allocated budget on a channel that actually has little impact on conversions.
Who should use this model?
Despite its extreme simplicity, the linear model is excellent for B2B companies with very long sales cycles, where it is important to remain in constant contact with potential buyers.
Time-decay attribution model
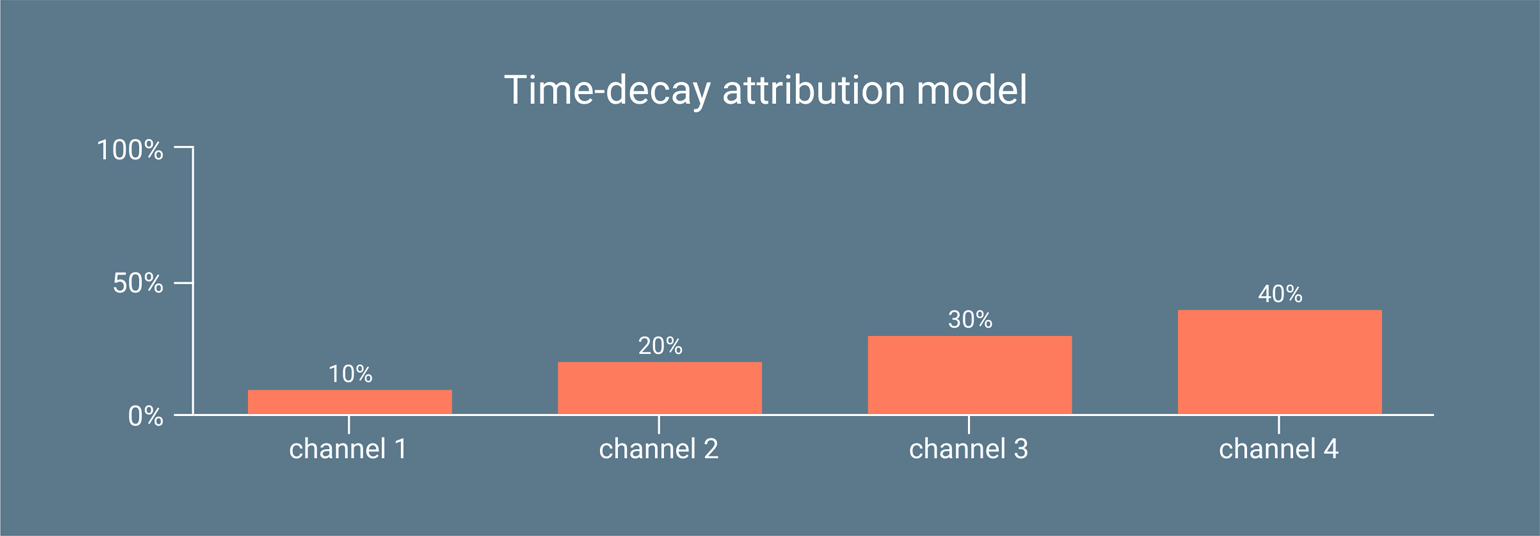
The time-decay attribution model gives greater weight to those marketing channels with which the customer interacted closer to the conversion.
Advantages
The time-decay model is one of the simpler multi-touch models. At the same time, it accurately describes the real behavior of a customer. First, a customer lands on your site. Next, he becomes interested in the goods and service that you are selling. The desire to make a purchase may arise, but only when desire coincides with opportunity does a purchase actually take place. Often, the last stage on the path to conversion takes place long after the first. The closer you get to the purchase, the shorter the distance between stages.
If you know the length of your sales cycle, you can fine-tune your attribution model and get the most accurate data on the contribution of each of your marketing channels.
Disadvantages
This attribution model undervalues the contribution of sources at the top of the funnel. These marketing channels are often responsible for sparking initial interest and often drive the majority of traffic to a site.
If you use a time-decay model and decide to cancel marketing channels that do not generate profit, be sure to track the number of conversions coming from other channels. It is very likely that canceling the marketing channels responsible for sparking initial interest will cause the amount of conversions from channels further down the funnel to decrease.
Who should use this model?
The time-decay model is one of the best multi-touch models and is excellent for companies with fairly short sales cycles. I recommend this model, rather than last-click, for the majority of online stores.
Position-based attribution model
The position-based attribution model is the most popular multi-touch attribution model. This model is used by 12.2% of companies.
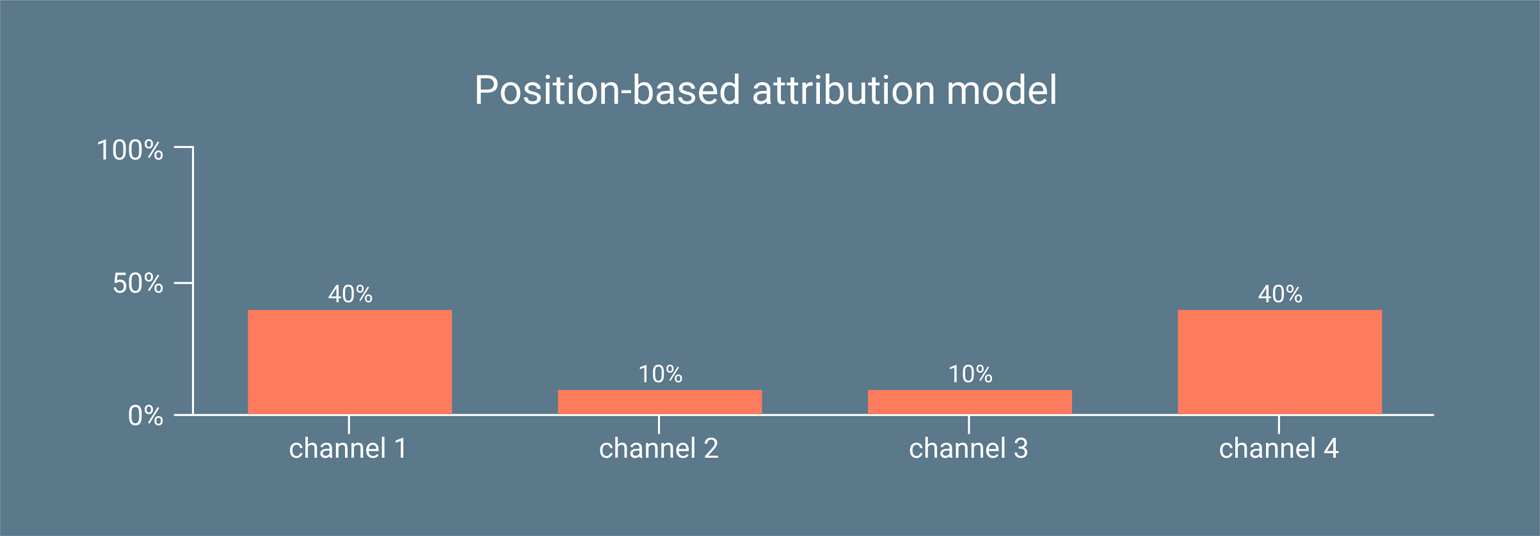
This model is a cross between the last-click and first-click models. Instead of assigning conversion value to the last or first channel only, the position-based model distributes credit equally between them. For example, the contribution of the first channel might be considered 40%, the contribution of the last channel is also 40%, and the remaining 20% is distributed equally to all channels in the middle of the funnel.
Advantages
In most cases, the first and last contacts do play the biggest role on the path to conversion. The first marketing channel is designed bring new visitors to your site. The second is designed to persuade potential buyers to make a purchase. If these two stages are clearly defined in your business, this model will work well for you.
Disadvantages
The position-based model undervalues the importance of sources in the middle of the funnel and overvalues the importance of sources on the top and bottom. Use this model only if you are absolutely sure that the first and last points of contact are the ones that are vital for your business.
Who should use this model?
This model works well if both the channel that sparks initial interest and the channel that directly leads to conversion are of equal importance to you. However, if you want a more accurate assessment of the contribution of each channel on the path to conversion, I recommend you consider other models.
Data-driven attribution model
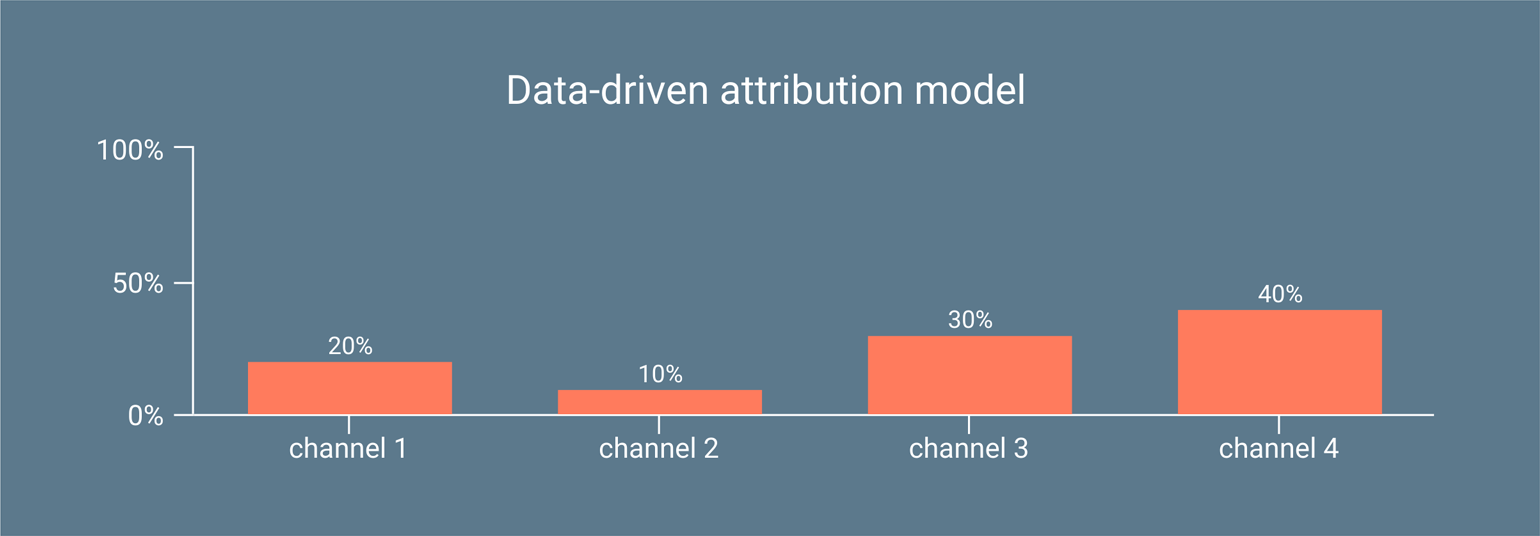
All of the models that we have discussed thus far use pre-defined rules. That is, either you or your analytics system decides what weight to assign to each channel. The model then bases its statistics on these preset values. Unlike these rule-based models, the data-driven model uses your own data to evaluate the real weight of each marketing channel on the path to conversion.
Advantages
This model reflects your business and your marketing channels with a high degree of accuracy. Your data forms the basis of the model itself. Likewise, the model uses this data to calculate the contribution of each channel. For these reasons, this model is the most accurate model available.
Disadvantages
There really aren’t any. However, since this model is built on data, you need to have a fairly large quantity of conversions in order to produce an accurate model. Unless you have an adequate number of conversions, your analytics system likely won’t allow you to use this attribution model. If it does, your model will turn out to be inaccurate.
Who should use this model?
Since this model is built on the basis of data about visits to a particular site, it works for everyone. You should use the data-driven model, if you have sufficient conversions to do so. You will always know the exact contribution of each of your marketing channels no matter how many channels you have or where they are located on the path to conversion (at the beginning, middle, or end). In the future, this information will help you decide which channels you should invest in and which aren’t worth your time and money.
Unfortunately, marketers use this model only 5% of the time. More often than not, though, this is due to the fact that a site lacks the volume of conversion data necessary to produce a viable model.
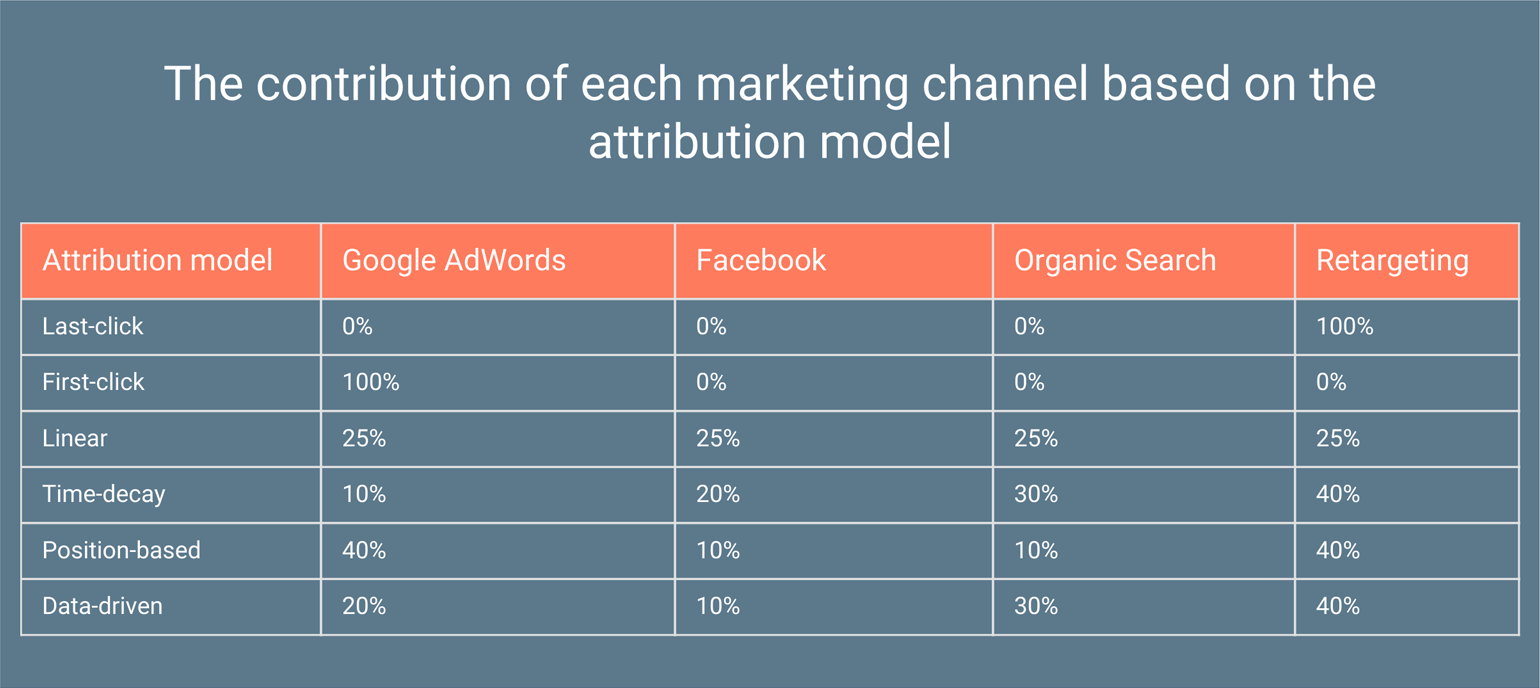
An example of how to calculate the contribution of marketing channels depending on the attribution model
Imagine that you are the owner of an online electronics store. A visitor first lands on your site, having clicked on an ad in AdWords. After some time he returns, this time arriving through your Facebook profile. Later he searches “buy a TV”, and returns to your site again. Finally, he makes a purchase after clicking on a retargeting ad. The various attribution models will calculate the contribution of each of channel in the following way:
- With the last-click model, retargeting receives all of the credit for the conversion.
- If you use the first-click model, your ad in AdWords receives credit for the conversion.
- The linear model considers clicks from AdWords, Facebook, the web search, and retargeting as equal contributors to the conversion.
- With the time-decay model, retargeting receives the greatest weight. This model gives slightly less weight to the web search and even less to the click from Facebook. AdWords receives the least credit for the conversion.
- The position-based model values the contributions of the AdWords campaign and retargeting at 40% each, and the clicks from social media and the web search at 10% each.
- The data-driven model will calculate the value of the marketing channels according to the effect they had on the conversion.
Why choosing the correct attribution model doesn’t solve all the problems of conversion attribution
You might have noticed that in order to correctly calculate the contribution of a marketing channel to a conversion, it is necessary that it result in the user clicking a link to your site. And that is a problem.
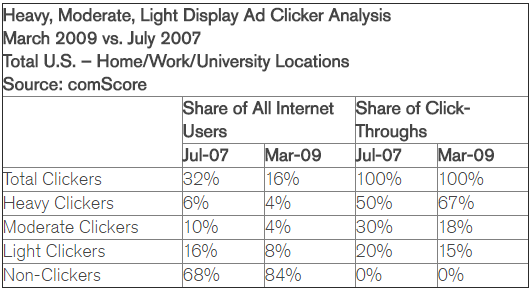
According to comScore, only 16% of Internet users click on display ads. Thus, the impact of display ads on the remaining 84% remains unknown.
Only 16% of Internet users click on display ads. Click To TweetFurthermore, the number of Internet users who don’t click on ads increases each year.
Imagine that you have launched retargeting. That is, your ad campaign will show ads to people who have already visited your site. They see a banner with your logo in your brand’s colors. Some users click on the ad, go to the site, and make a purchase. Your attribution model will take the conversion of these users into account. Most users see your banner, but don’t click on it. They enter your site’s address directly into their browser, go to your site, and make a purchase. Your attribution model will attribute these conversions to a direct visit (or a marketing channel higher in the funnel). However, it is likely that the banner ad reminded your visitor about your store and, thus, led to the purchase.
This problem can be partially solved by simultaneously accounting for both click-through conversions (CTC) and view-through conversions (VTC).
View-through conversions
Just as you probably wouldn’t call the number on a billboard that you saw only a second ago, you probably won’t make a purchase immediately after seeing an ad on the Internet. A customers may require 7 to 13, or even more, contacts and a few days or even weeks before they go to your site and preform the desired action.
Just as you probably wouldn’t call the number on a billboard that you saw only a second ago, you probably won’t make a purchase immediately after seeing an ad on the Internet. Click To TweetAds rarely influence a customer to make a purchase here and now. In most cases, the goal of advertising is to ensure that your company comes to mind first when a person or company needs a product or service that you sell. This happens in the future. Maybe in a day, a week, a month, but not now.
But how can we know if an ad has led to a conversion when so much time has passed from when the customer saw it.
Accounting for view-though conversions will help correctly determine the impact of ad views on conversions. If a customer saw your ad and didn’t click on it, but later returned to your site and made a purchase, you can count that conversion as a view-through conversion.
By accounting for view-through conversions, you will receive a more accurate depiction of which marketing channels are working and which ones aren’t. This concerns display ads most of all. It is likely that you have already launched one or more of these campaigns, including retargeting, which you evaluate based only on click-through conversions. View-through conversions will help you to fully understand the effectiveness of these campaigns.
In order to give a rough estimate of how many view-through conversions marketers overlook and incorrectly attribute to advertising channels, we took a sample from Rontar’s Big Data platform. This sample gives a picture of the volume of click-through conversions and view-through conversions for retargeting.
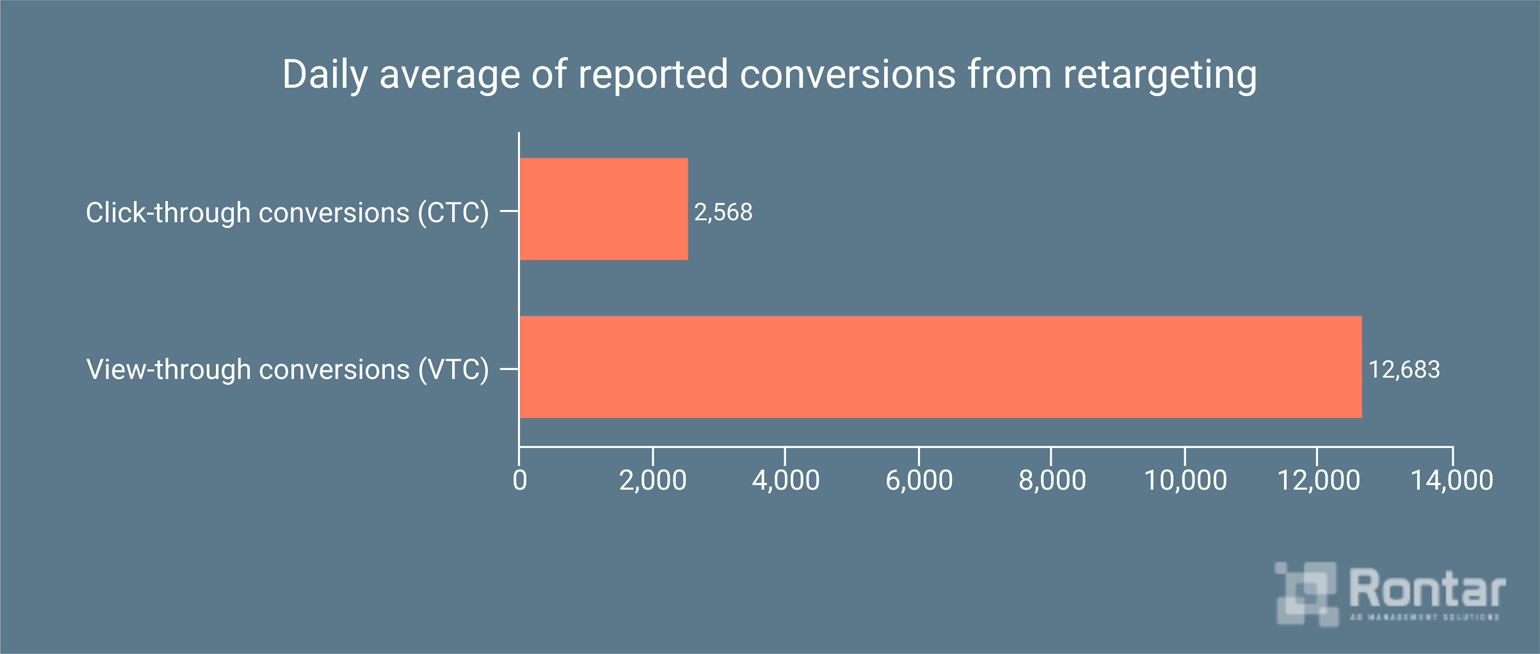
As you can see, the ratio of click-through conversions to view-through conversions is approximately 1:5. And this is when you set the conversion window to one day following the view. If you set the conversion window to 7 days, the difference in the ratio will be even greater.
However, counting view-through conversions is difficult for several reasons:
- Sometimes it is very difficult to determine if a conversion occurred after viewing a display ad or after clicking on a different channel. In the case of click-through conversion, an order is often made immediately following the click. That is, the time gap between the click and the conversion is minimal. In case of view-through conversion, a day or even a week may pass before the conversion takes place. The long timeframe increases the chances that the conversion will be attributed to the customer’s interaction with another marketing channel, such as a web search or social media, rather than view-through conversion. In this case, the target action might be counted twice: as a click-through conversion and as a view-through conversion. Duplication can be partly avoided by severely restricting how long after a view view-through conversions will be counted. By doing so, you will lower the chances of customer interaction with another channel during the time between the view and the conversion. The disadvantage to this method, however, is that you might greatly underestimate the number of view-through conversions.
- Click-through conversions and view-through conversions are tracked in different interfaces. By setting up the correct UTM parameters in your links, you can accurately track which channels lead to click-through conversions. To track view-through conversions, you would need your advertising platform to be more closely integrated with your analytics system. Unfortunately, I don’t know of any such system that exists today. Google Analytics allows you to track view-through conversions, but only for its own display network.
A/B test: testing the influence of views on the number of conversions
We decided to conduct an A/B test in order to see the effect of views on conversion. First, we divided the audience of an online electronics store into two groups. We showed the first group, consisting of 127,163 unique users, an ad for the store with a reminder about those products that had interested them earlier. The second group, 104,883 unique users, saw an ad that was completely unrelated to the store that they had visited earlier.
We received the following results:
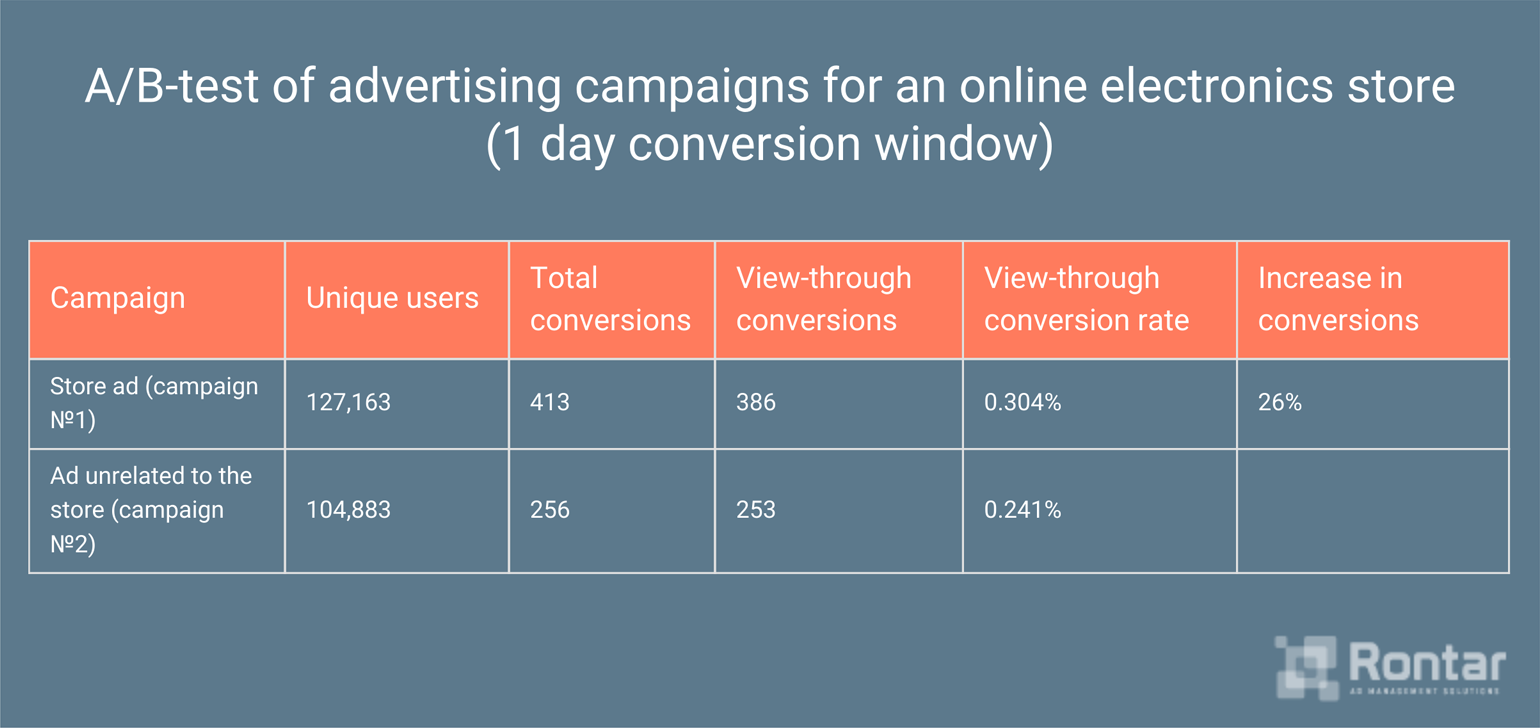
Users in the second group completed 256 conversions. The view-through conversion rate was 0.241%. Since this group didn’t see the ad for the store and the products that had interested them earlier, we can assume that these users had already planned their purchase, and advertising did not influence their actions.
Users in the first group completed 413 conversions. Of these, 27 were made after clicking on a banner, and another 386 were made some time after these users saw the ad for the store. The view-through conversion rate was 0.304%.
To calculate the increase in conversions as a result of viewing the ad, we used the following formula:
Increase in conversions = (conversion rate of AC №1 – conversion rate of AC №2) / conversion rate of AC №2,
where:
— conversion rate of AC №1 is the view-through conversion rate for the group that saw the store ad;
— conversion rate of AC №2 is the view-through conversion rate for the group that did NOT see the store ad.
Results:
Increase in conversions = (0,304 – 0,241) / 0,241 = 26%
Thus, there were 26% more conversions in the group that saw the store ad than in the group that didn’t. These results demonstrate that a store actually receives 26% more conversions from an ad campaign than show up in an analytics system that is tracking click-through conversions. It is necessary to take this into account when evaluating the effectiveness of an advertising channel.
Please note, too, that this data is based on an attribution window of 1 day. That is, a number of conversions are not taken into account.
What an attribution window is and how to set it
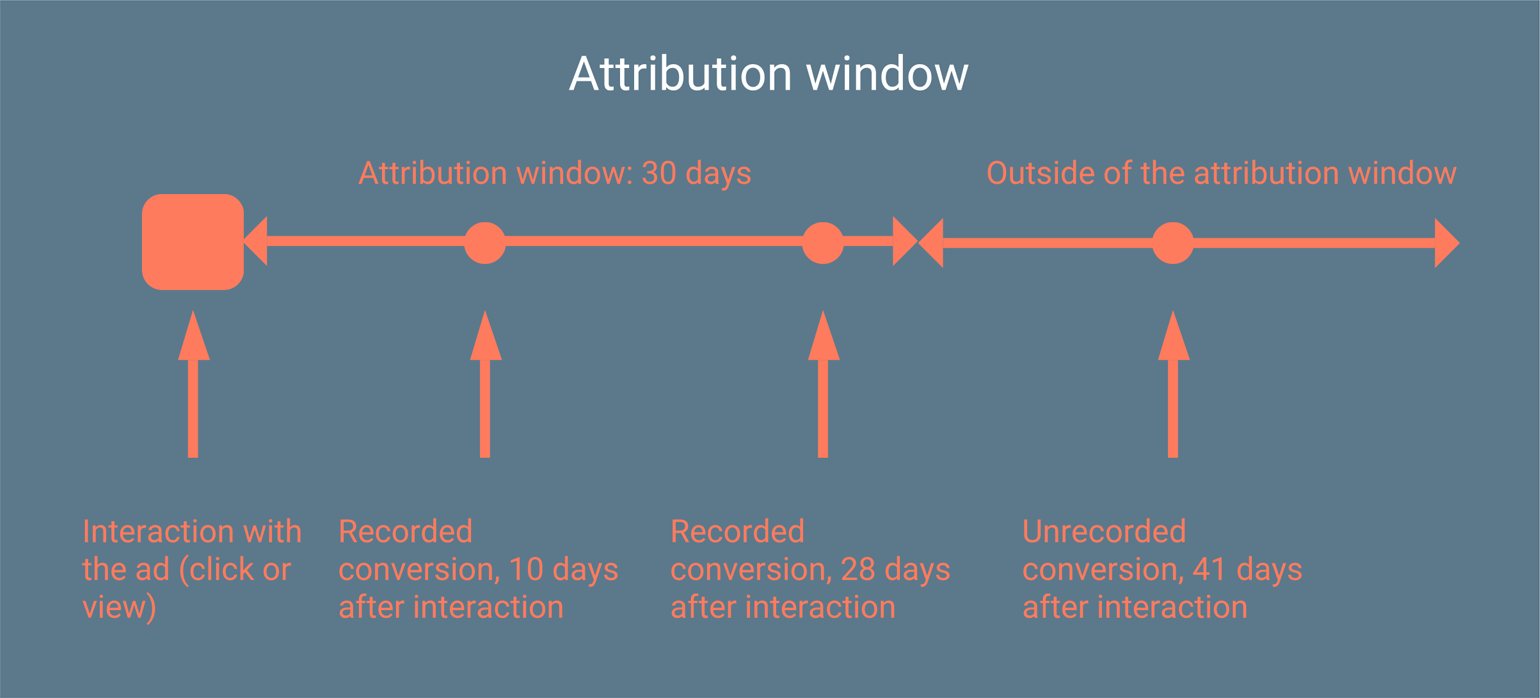
The attribution window is the interval of time after a user’s interaction with a marketing channel during which conversions will still be attributed to that channel.
Example: 7-day attribution window
- A user clicks on an ad in AdWords and lands on your site. After 3 days, he returns to the site and makes a purchase. The advertising campaign in AdWords receives credit for the conversion.
- A user clicks on an ad in AdWords and lands on your site. After 9 days, he returns to the site and makes a purchase. The advertising campaign in AdWords does NOT receive credit for the conversion.
All analytics systems have a default attribution window. The default attribution window in Google Analytics is set to count conversions that occurred 30 days after a click and 1 day after a view (only for display ad campaigns in its advertising network). The settings in other systems may vary. However, you can change the settings.
Default settings are unlikely to give you an accurate picture of the effectiveness of your marketing channels. Ideally, you should set the attribution window to match your company’s actual sales cycle. The length of a sales cycle depends on the type of business, and can vary greatly from business to business.
If you have an online store, most conversions will take place 7-10 days after a user first visits your site. If your sales cycle is 10 days, but you count conversions for 30 days after a click, you risk incorrectly attributing conversions to a marketing channel that, in fact, did not influence them.
Imagine that a person lands on your site by clicking on your AdWords ad. He then leaves the site without having bought anything. After 23 days, he returns and makes a purchase.
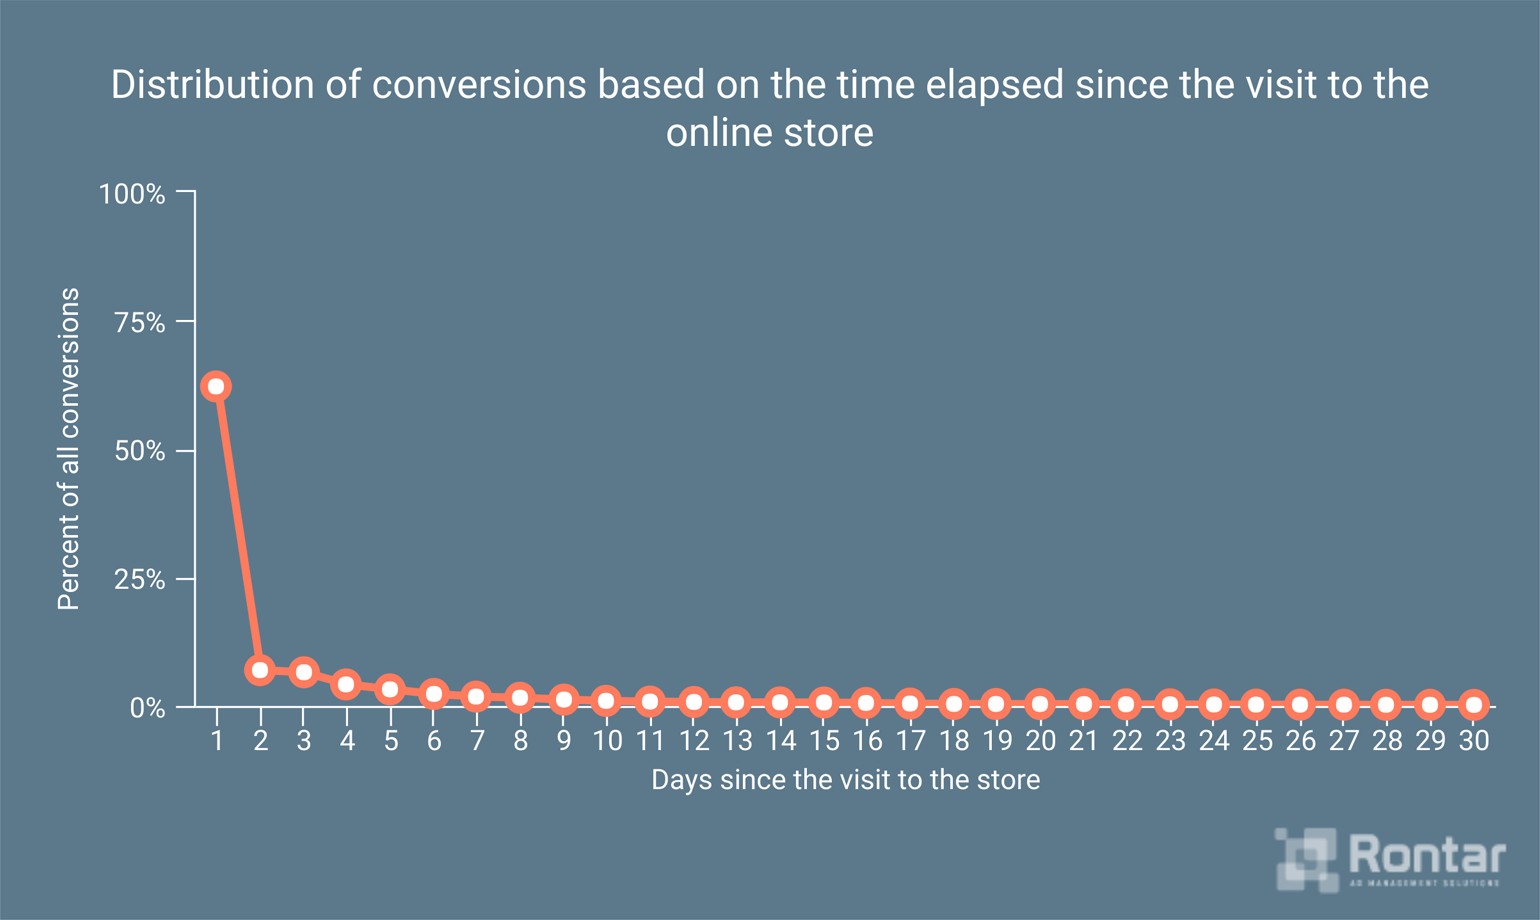
The product is a jersey with the name of a popular soccer player. It doesn’t cost much and doesn’t require a very long decision-making process. What is the probability that the advertising campaign in AdWords influenced a purchase that was made 23 days after the user first visited your site? Especially considering that your customers make 91% of their purchases in the first 10 days after visiting your store for the first time. And 62% of users make a purchase on the very same day that they visit a site.
62% of users make a purchase on the very same day that they first visit a site. Click To TweetThe probability is very small. More likely, the user either saw your retargeting banner, or looked at your Facebook profile and saw an update. Possibly, he had signed up for your email list, remembered you, returned to your site, and made a purchase. As a result, the campaign in AdWords receives all the credit for the conversion, which it, likely, does not deserve.
The situation will be even worse, if the reason for the conversion is a different advertising channel, say retargeting, whose effectiveness you evaluate not only through clicks but through views as well. You track the statistics for this channel, not in Google Analytics, but in the advertising system where you have launched the retargeting. In this case, you might count one real order as two conversions. Your analytics system will count the order as a click-through conversion from the AdWords advertising campaign. The retargeting report will also count it as a view-through conversion. Narrowing your attribution window to the length of your sales cycle won’t completely eliminate duplicate conversions. However, it will significantly reduce the number of such cases.
Your sales cycle may last 40 days or more, if you have a B2B company or you sell a complicated and expensive product, which requires a long decision-making process. If you leave the attribution window at the default 30 days, the reports on your analytics systems may not reflect the majority of your conversions at all. In this case, you can only guess which marketing channels work and which don’t.
In order to reset the attribution window, you will need to know the exact length of your sales cycle. Practically all analytics systems include a report on the average number of days between a user’s first visit to the site and conversion.
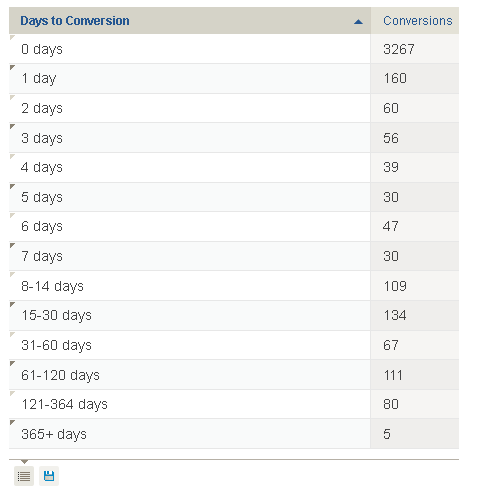
It doesn’t make sense to set an attribution window of more than 7 days, if you see that 80-90% of conversions occur in the first 7 days. If a lot of conversions take place 20-30 days after the first visit to the site, it makes sense to widen the attribution window to 60 days. Later, return to the report to see how the results have changed.
This concerns the attribution window for click-through conversions. Regarding view-through conversions the situation is not entirely clear. The A/B test, which we conducted in order to understand how ad views affect the number of conversions, provided the following results:
In this test, the attribution window was set at 1 day, and the increase in view-through conversions was 26%. We decided to continue the test and see what the results would be if we counted conversions, not just for 1 day after the ad view, but 7 days (a popular attribution window for view-through conversions in many advertising networks). We received the following results:
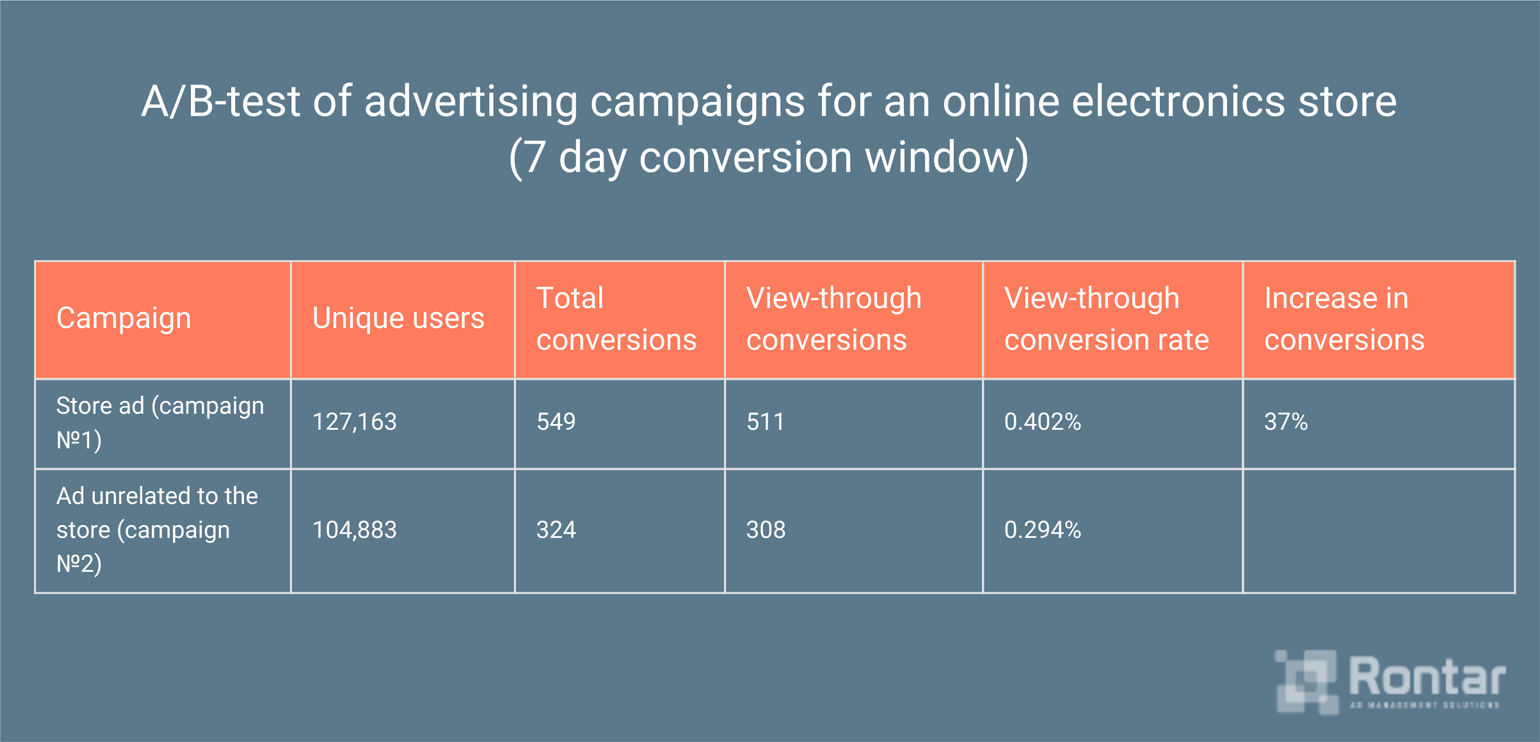
As you can see, if you set the attribution window at 7 days, then view-through conversions increase 37%. These are conversions that would not have occurred if the users had not seen ads for the store. At first glance, it seems like a good idea to evaluate this advertising channel based on a 7-day, if not longer, attribution window for view-through conversions. However, I advise always using a 1-day window.
As I’ve already mentioned, you will track click-through conversions and view-through conversions in different reports and different systems. You’ll use Google Analytics or another analytics system to track click-through conversions. The ad networks where you have launched your display ads will track your view-through conversions.
If, for example, your attribution window is 14 days for click-through conversions and 7 days for view-through conversions, then there is a good chance that your system will count one action (a purchase on the site, an application, the download of an e-book, etc.) a few times in different places. And that is the worst thing that can happen. A wide attribution window can also cause the number of view-through conversions to be overstated. With a wide enough window, credit for practically all of the conversions that take place on a site can go to one advertising channel.
It is worth noting that an unjustifiably wide attribution window for view-through conversions is exactly what gave view-through conversions their initial negative reputation.
An unjustifiably wide attribution window is exactly what gave view-through conversions their initial negative reputation. Click To TweetGoogle first started displaying view-through conversion statistics for its own advertising network in September of 2009. They set the attribution window for view-through conversions to the same length as that for click-through conversions, namely 30 days. Naturally, this led to an artificial inflation of the statistics for those conversions. How can you be sure that a customer bought something on your site because he saw an ad for your store on the Internet 26 days ago? More likely, he had already decided to make a purchase and was simply waiting for the right moment/opportunity. Seeing the ad had absolutely no influence on him.
As a result, marketers began to doubt the accuracy of view-through conversion statistics. After awhile, they ceased to consider these conversions when they analyzed the effectiveness of their advertising campaigns.
In March of 2017, Google announced that it had narrowed the attribution window for view-through conversions to one day. This way, marketers could trust the accuracy of the data and could take view-through conversions into account again when analyzing the effectiveness of their advertising.
Taking this into account, no matter the analytics system you use to monitor view-through conversions, always use a 1-day attribution window. Doing so will help you avoid duplications and overstated view-through conversions in your reports.
Conclusion
The more advertising and, in general, marketing channels you use and the higher your marketing budget the more important proper conversion attribution will be to you.
When choosing a particular model, always keep in mind what your business is, what type of product you sell, and how long your sales cycle is. These factors will determine what attribution model best suits your business.
Also, don’t be afraid to replace your current attribution model, if necessary. According to a survey conducted by Bizzible, 30.2% of respondents planned to replace their current attribution model in the next 6 months. This is a normal evolutionary process, and there is no need to be afraid of it.
Furthermore, don’t forget that if display ads are one of your main marketing channels, your chosen attribution model will only give you part of the picture. Always monitor view-through conversions. Doing so will allow you to fully discern which channels work and which don’t.
What kind of business do you have and which attribution model do you use? Do you track view-through conversions and if yes, how do you evaluate them?